

Global Warming is Real
Beginning in 1990 atmospheric CO2 levels have been monitored on the top of Hawaii's Mauna Loa.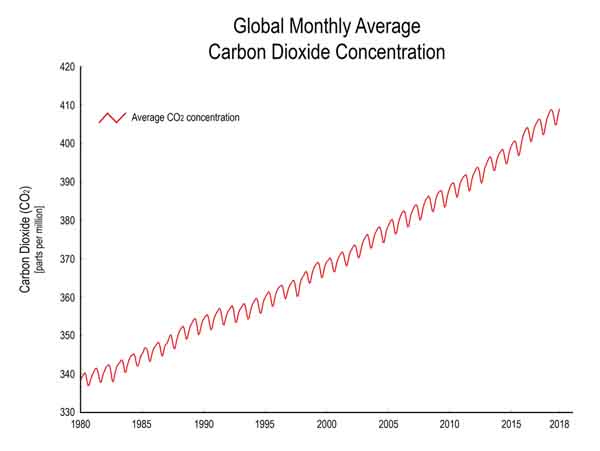
The level of atmospheric CO2 has continued to rise despite the efforts of the IPCC. The current level is 410 ppm.
There is a direct correlation between atmospheric CO2 content and average global temperature.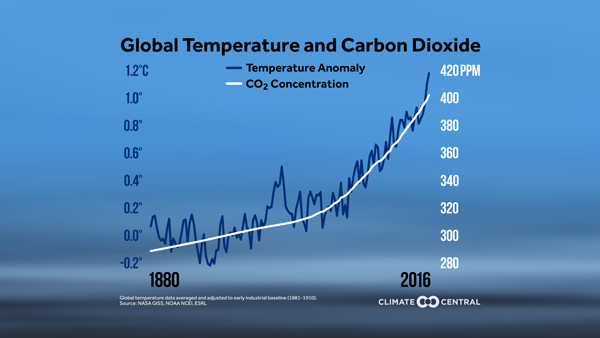
A common claim of climate change deniers is that global warming is all due to variations in the sun's output. The following shows this is not the case. 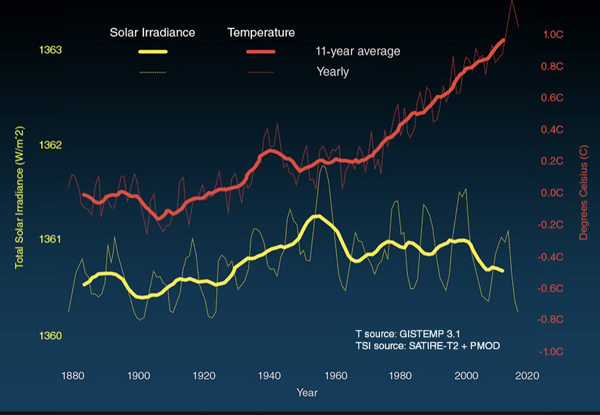
The average global temperature has continued to increase as solar radiation has remained stable or decreased.
The majority of the accumulated CO2 was from human sources - fossil fuels, cement and flaring of methane.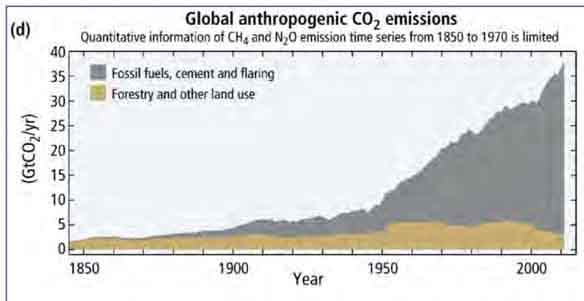
These levels are higher than they have been in 800,000 years.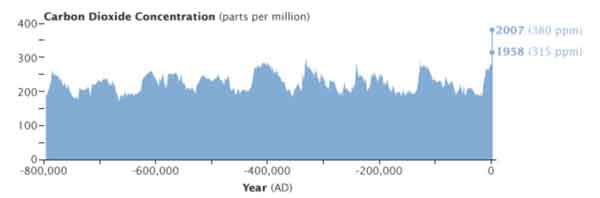
Gases other than CO2 are also important but CO2 is driving them all.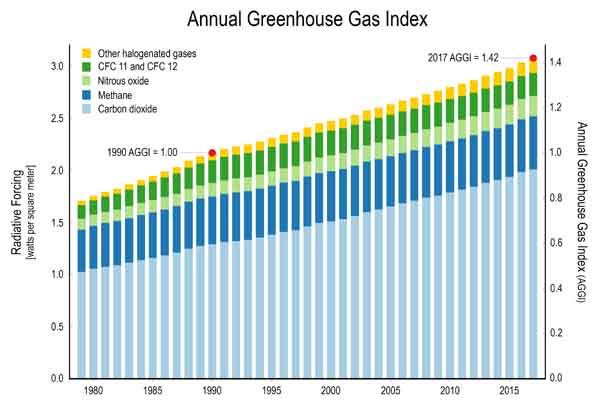
One claim of climate change deniers is that the present warming is simply the result of "natural climate variability." An article in the July, 2019 Nature (18) shows that interspersed warm and cold periods have occurred for the past 2,000 years but only in the recent past have the oscillations been predominately warming and hotter (see circle).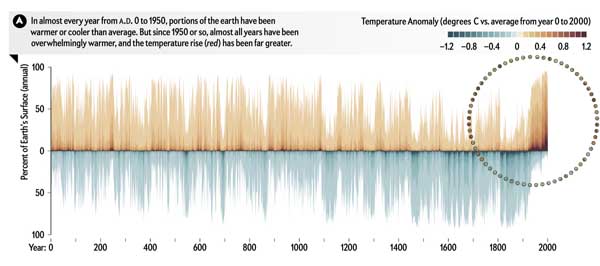
This is also apparent when focusing on the last 140 years (below).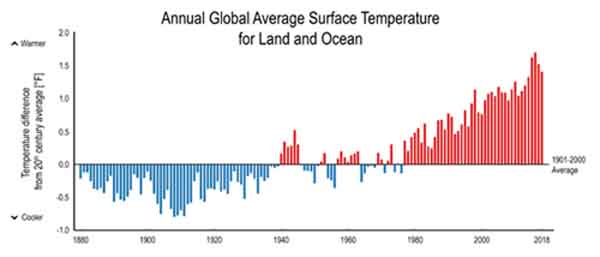
It really is getting hotter - obvious if you listen to weather reports.
The seas all over the world are warmer.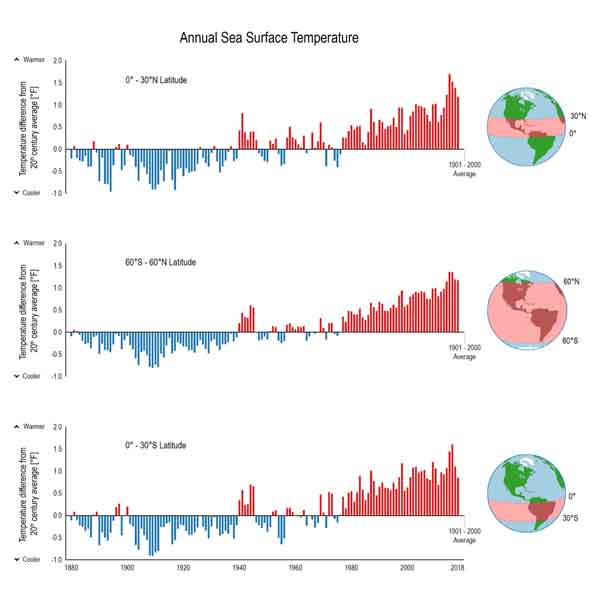
The arctic (and antarctic) ice is melting.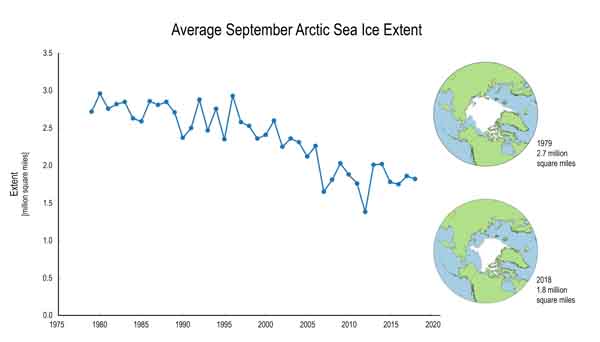
And thus the sea levels are rising.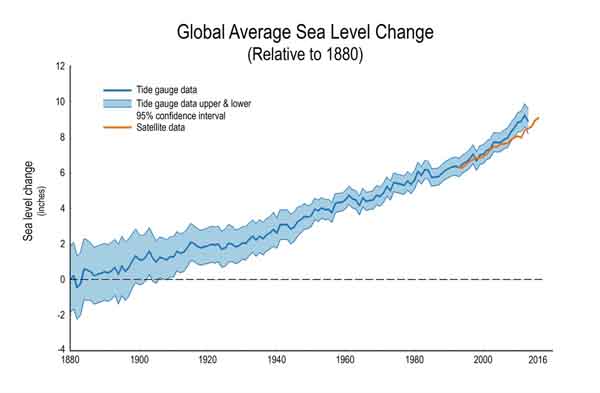
The following figure (17) shows that these sea level rises are truly world-wide. Climate change deniers love to claim the sea level is not rising everywhere. This clearly shows the falsity of this claim.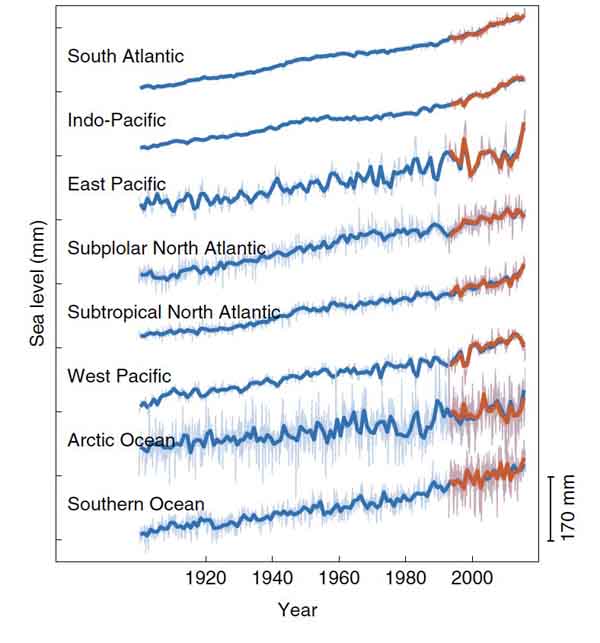
Heat waves are increasing in frequency and duration.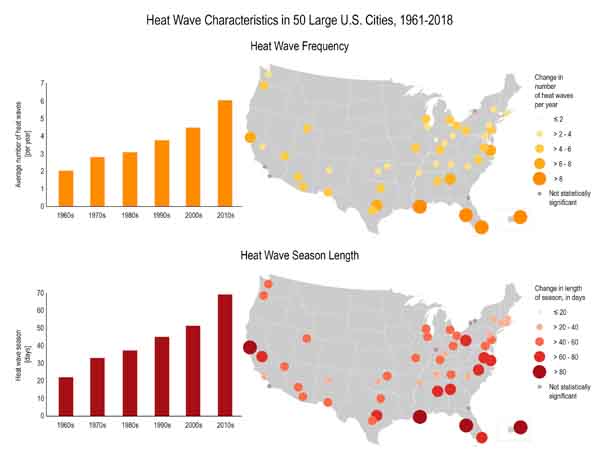
And the economic costs progressively increase.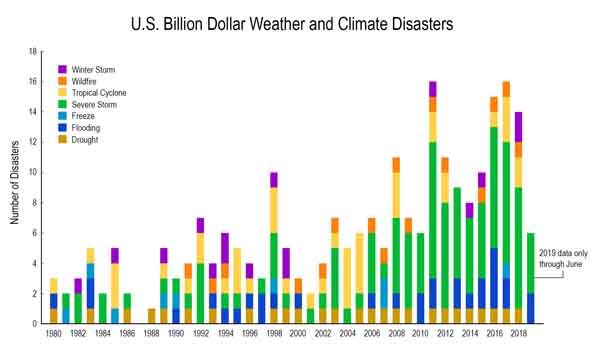
A major reason that scientists think the current warming is not from natural influences is that, over the past century, scientists from all over the world have been collecting data on natural factors (non-human influence) that influence climate—things like changes in the Sun’s brightness, major volcanic eruptions, and cycles such as El Niño and the Pacific Decadal Oscillation. These observations have failed to show any long-term natural changes that could fully account for the recent, rapid warming of Earth’s temperature.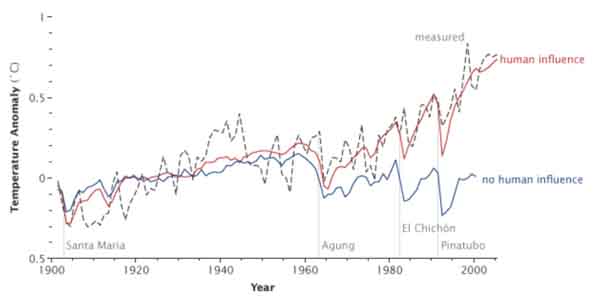
Human influence alone is responsible for the current high levels of atmospheric CO2.
2018 UN IPCC Climate Report - A world of worsening food shortages and wildfires, and a mass die-off of coral reefs as soon as 2040. The damage would come at a cost of $54 trillion.
A landmark report from the United Nations’ Intergovernmental Panel on Climate Change (IPCC) scientific panel on climate change paints a far more dire picture of the immediate consequences of climate change than previously thought and says that avoiding the damage requires transforming the world economy at a speed and scale that has “no documented historic precedent.”
The report was written and edited by 91 scientists from 40 countries who analyzed more than 6,000 scientific studies. The Paris agreement set out to prevent warming of more than 3.6 degrees above preindustrial levels — long considered a threshold for the most severe social and economic damage from climate change. The new report concludes that in reality we need to limit it to 1.5 C. The consequences of warming above that level: more heat waves, more severe rain and snow events, higher sea levels, damage to agriculture and displacement of millions of people.
It is not the purpose of this page to review the vast amount of science supporting the reality of global warming or the politics and funding of the global warming deniers. This is well covered in the attached references. Instead this page will present a few of the areas of most concern to us and most importantly, see Position Paper, ways in which the the Comings Foundation might help.
Despite the fact that 100% of the scientists who have actually done research and published in the field of climate science believe that global warming is real, is due to the massive burning of fossil fuels, and is a threat to the world economies, some scientists whose expertise is in other fields have joined a group of global warming deniers. Whole books have been written on the subject of the origin, politics and funding of the global warming deniers (Refs 1-5).
The Consequences and Tipping Points of Increased Global Warming
Melting Ice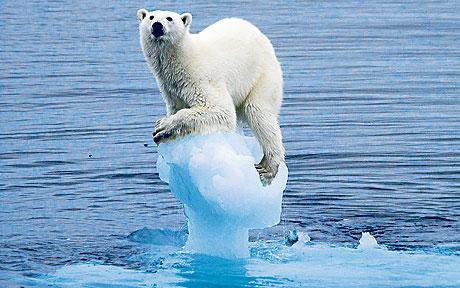
Ice is at the core of the controversy. If global warming is real, the global ice caps will start to melt and this will cause a rise in sea level. If left unchecked this will be the source of one of many of the negative consequences of global warming.
Since oceans have a great capacity to adsorb and buffer CO2 the deniers claim this has had no adverse effect and that there is no evidence that the global ice caps are melting. While direct observations suggest various ice sheets in some places are melting and decreasing in size, the deniers claim that this is all counterbalanced by expansion of ice sheets in other places.
The Gravity Recovery and Climate Experiment (GRACE) satellite has now solved this issue. Rather than measuring the volume of ice sheets every few years as most earlier surveys have done, GRACE “weighs” them from month to month with a pair of spacecraft launched in March 2002 (5). Flying in tandem 220 kilometers apart, the satellites can measure subtle variations in the pull of gravity as they pass over a large mass on the surface. By beaming microwaves from one to the other, they precisely gauge the changing distance between them as the added mass tugs first on the leading satellite and then on the trailing one. Changes in gravity from pass to pass reflect changes in the icy mass below.
This has shown that the mass changes of Greenland and Antarctica 2002 to 2009 have all been negative. On Greenland the rate of ice mass loss doubled over this time period with an acceleration of -30 cubic kilometers lost per year. This is illustrated in the following figure. 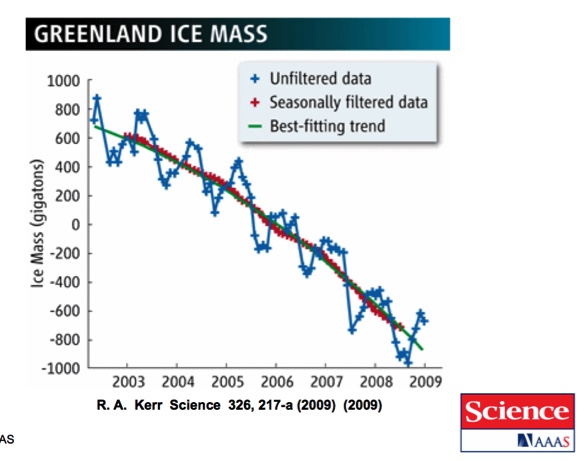
The trend line of Greenland ice mass (green) curves downward with time, suggesting that losses have been accelerating (6).
The GRACE satellites actually continued to obtain data. What happened in Greenland after 2009 and what happened in Antarctica from 2002 to 2016 is shown in the following two figures.
Results of GRACE for Greenland from 2002 to 2016. NASA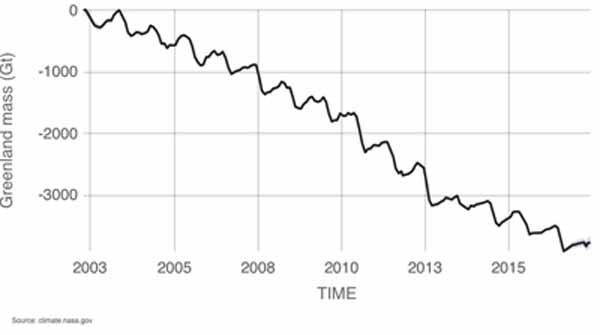
Results of GRACE for Antarctica from 2002 to 2016. NASA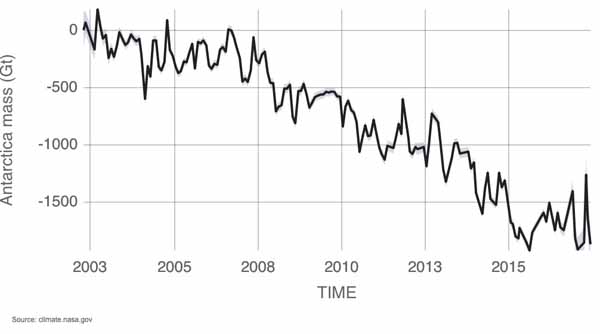
Tipping Points. The term tipping point refers to levels of global warming that once reached result in a rapid acceleration (positive feedback) in the rate of warming above what would occur with a simple extrapolation of business as usual. 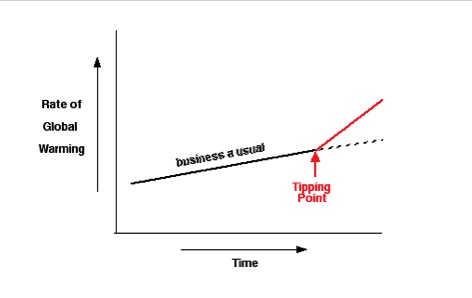
Concept of Tipping Points
Positive feedback means that each increase stimulates a further increase. Positive feedbacks have the capability of taking off exponentially. They are extremely dangerous.
The following figure shows the worldwide location of some of the most serious tripping points (19). See also (7) and (8).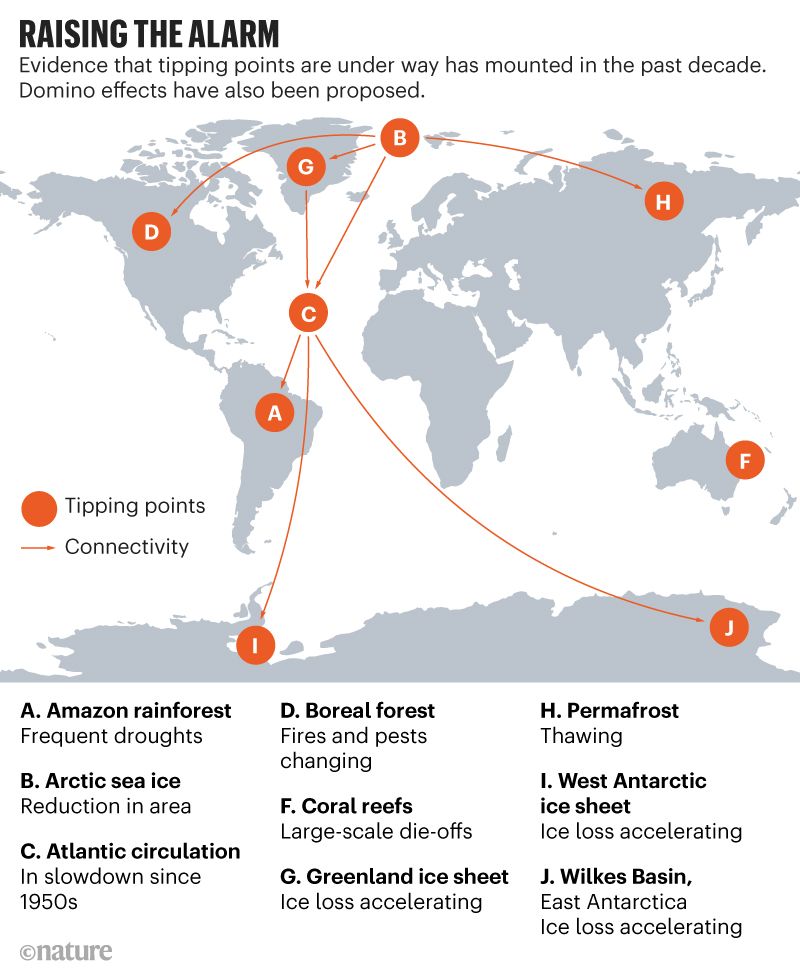
These were originally proposed to occur after to 2oC to 6oC of global warming. The most recent assessments indicate some are occurring now and more will occur with as low as a 1.5oC rise. The ones occurring now are the following.
Melting of the Tundra Permafrost with Release of Gigatons of Methane and Carbon Dioxide.
There are enormous quantities of naturally occurring greenhouse gasses trapped in ice-like structures in the cold northern muds and at the bottom of the seas. These ices, called clathrates, contain frozen methane. Methane is more than 40 times as strong a greenhouse gas as carbon dioxide and is eventually converted to C02. Arctic and boreal permafrost contain 1460–1600 Gt organic carbon, almost twice the carbon in the atmosphere There are 400 gigatons of methane locked in the Arctic tundra. A further temperature increase of a few degrees centigrade could begin to melt the arctic tundra resulting in giant “burps” of methane gases.
Monitoring by Russian scientists suggests that the permafrost shell is already starting to break up in places releasing millions of tons of methane into the atmosphere of the Arctic. Especially worrying is the observation that up to 10 percent of this area is now being punctured by so-called taliks. These are areas of thawed permafrost that provide avenues for the ready escape of methane and opportunities for warmth to penetrate deep into the frozen hydrate beneath. 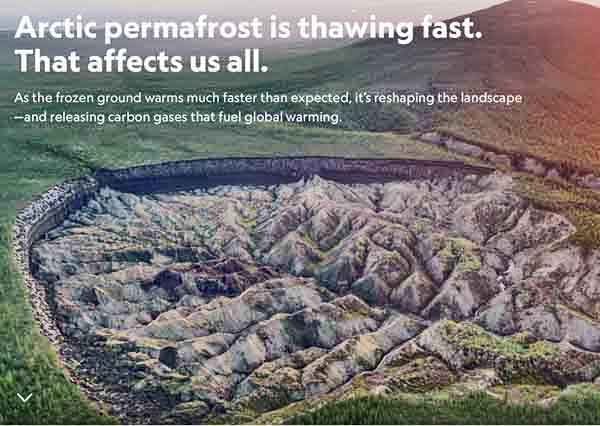
The Batagaika crater (talik) in eastern Siberia, half a mile wide and growing, is the largest in the Arctic (16)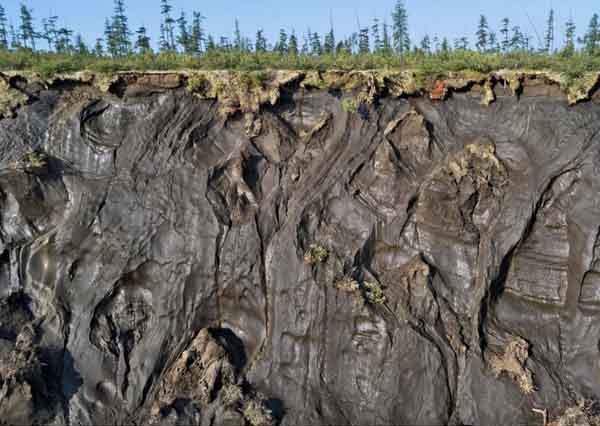
The ancient soils of Arctic permafrost, seen here in the wall of the above crater. They hold the organic remains that died thousands of years ago. All this carbon has been safely sequestered in frozen earth, until NOW.
Natalia Shakhova (14) of the University of Alaska’s International Arctic Research Center is concerned that up to 50 billion tons of methane could be released abruptly and without warning from the Arctic seabed, pushing up the methane concentration of the atmosphere 12-fold virtually overnight and driving cataclysmic warming. Once triggered the increase in temperature would start a vicious cycle of the release of even more and more methane (i.e positive feedback). This scenario is not just the ramblings of environmental scare mongers. It has happed before (9-10, 14).
The most recent of these catastrophes occurred about 55 million years ago in what geologists call the Paleocene-Eocene Thermal Maximum (PETM) when volcanic methane burps caused rapid warming and massive die-offs, disrupting the climate for more than 100,000 years. The granddaddy of these catastrophes occurred 251 million years ago, at the end of the Permian period, when a series of volcanic methane burps came close to wiping out all life on Earth. More than 94 percent of the marine species present in the fossil record disappeared suddenly as oxygen levels plummeted and life teetered on the verge of extinction. Over the ensuing 500,000 years, a few species struggled to gain a foothold in the hostile environment. It took 20 million to 30 million years for even rudimentary coral reefs to re-establish themselves and for forests to re-grow. In some areas, it took more than 100 million years for ecosystems to reach their former healthy diversity (8).
There are 10,000 gigatons of methane clathrates under the continental shelves. However, in contrast to the permafrost methane, which could be released in a short time frame, it is estimated that sufficient ocean warming to release these underwater clathrates may take much longer. (9).
The release of methane from volcanoes triggered these past tripping points. According to the U.S. Geologic Survey burning fossil fuels releases 150 times the amount of CO2 as emitted by volcanoes. Through the mechanism of burning fossil fuels humans are clearly capable to reaching the methane “burp” tipping point. Once it is reached there is virtually nothing that can be done to rescue the earth from serious harm. The answer is prevention.
Loss of Ocean Phytoplankton 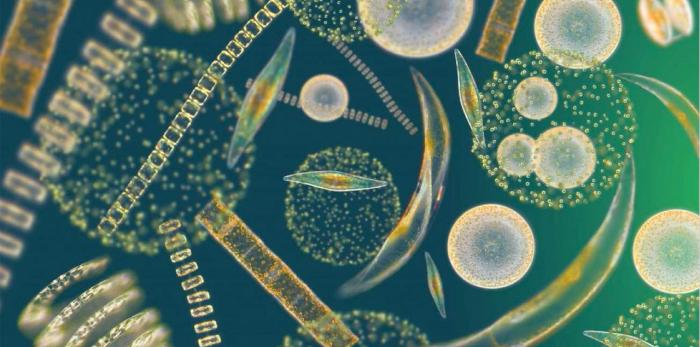
Phytoplankton consist of two species, cyanobacteria and single celled algae. Both are capable of photosynthesis and thus of converting CO2 to sugars and O2. In the early earth, cyanobacteria were responsible for the production of the oxygen in the atmosphere. It took about a billion years of producing oxygen before all of the oxygen sinks, such as iron containing rocks, were filled and the levels of oxygen in the atmosphere began to rise. In recent years remarkable facts about the role of ocean phytoplankton in the carbon dioxide cycle of the earth have been uncovered. Obtaining this data required the Costal Zone Color Scanner (CZCS) satellite launched by NASA. It was found that phytoplankton incorporated 45 to 50 billion tons of carbon into their cells each year (11). This was twice the level of all previous estimates. In addition it was found that land plants incorporated 52 billion tons of inorganic carbon each year, half of previous estimates. In summary, although they amount to less than 1% of the photosynthetic biomass of the earth, phytoplankton contributes almost half of the total photosynthetic activity. This difference is due to the fact the land plants have an average turnover of once every 10 years compared to once a week for the active phytoplankton (11). When the phytoplankton dies they sink to the boom of the ocean effectively burying the carbon dioxide.
This massive effect of phytoplankton on fixing carbon dioxide means that anything that inhibits phytoplankton turnover would have a profound effect on global warming. If the phytoplankton pumping CO2 to the deep ocean stopped tomorrow the level of CO2 in the atmosphere would eventually rise by an additional 200 ppm. Unfortunately, this carbon cycle is inhibited when ocean water warms. Warm water is less dense and does not mix as well with the nutrient-rich cold water beneath it. Global warming as already begun to slow down the sequestration of CO2 by phytoplankton. Further warming will produce a positive feedback to further global warming.
Of the 250 companies listed in Carbon 180's Circular Carbon Network, only two directly address this problem - Seaquestration and Ocean Based Climate Solutions (see TheComingsFoundation Position Paper).
Forest Wildfires.
The Camp Fire, California.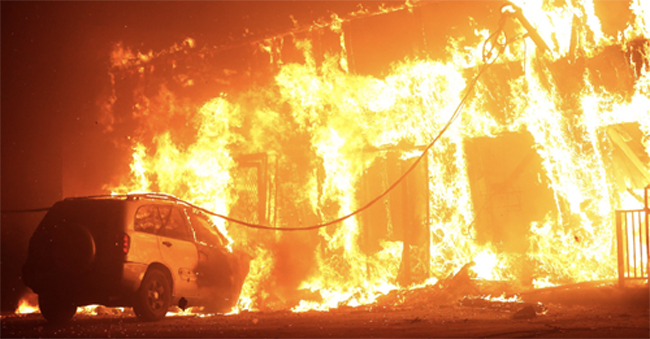
Sydney, Australia fire storm.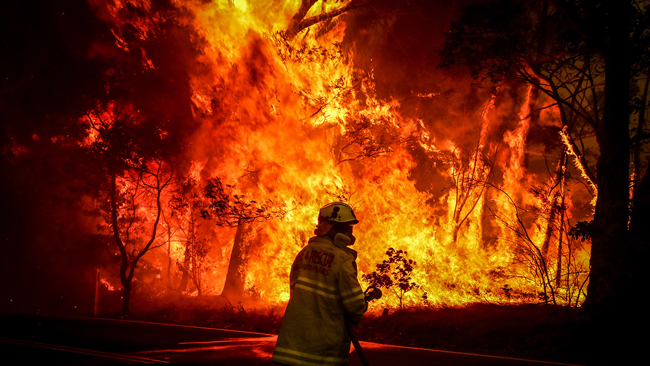
Paradise, CA after the fire.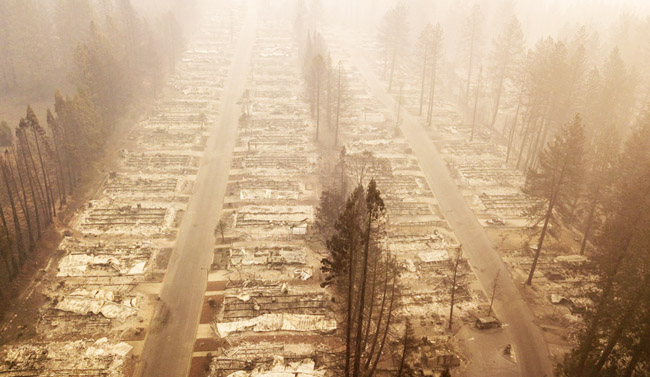
The trees and forest and the soil store huge amounts of CO2. The process of photosynthesis, unique to plants, converts atmospheric CO2 into oxygen and carbon contained in sugars, lignin, cellulose and other compounds. When trees die this carbon is sequestered into the soil. As the global temperature increase the forests become drier and susceptible to huge forest wildfires which release large amount of CO2 leading to further warming.
The following figure shows the amount of carbon released by California Wild Fires.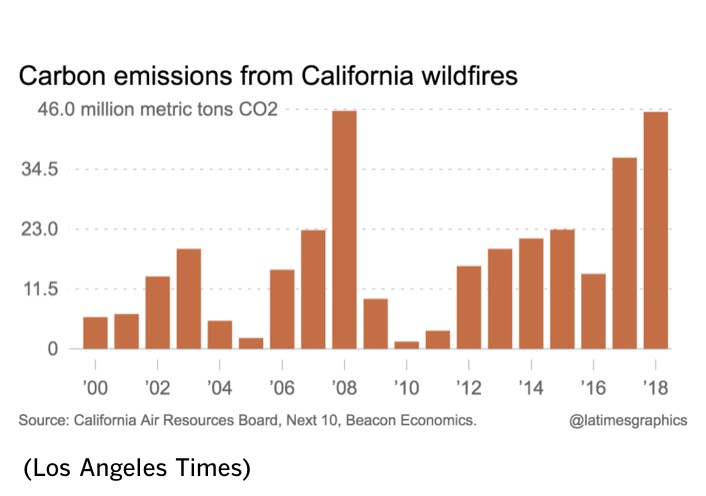
In 2008 and 2018 wild fires in California released 48 million metric tons of CO2. A 500 MW coal fired power plant releases 4 million tons per year. Thus, these two seasons each released the equivalent of 11 years of CO2 released by coal fired power plants. While on other years there was less release of CO2 by wild fires, California represents only a fraction of world wide fires.
Loss of the Earth’s Albedo.
The albedo of an object is a measure of how strongly it reflects light and thus heat. The albedo of the polar ice sheets contribute significantly to cooling the earth because of the heat they reflect back into space. As the polar ice sheets melt this cooling effect is progressively lost leading to more warming and more melting ice. As shown in figures 2 to 4 there has been a significant loss of ice and thus albedo in both Greenland and the Antarctic.
If the progressive rise in atmospheric CO2 had no consequences there would be nothing to worry about. Thus, the issue of consequences occupies a central position to the concerns about global warming. The following, which summarizes some of the consequences, was adopted from the 2010 report of the National Research Council (12). In their executive summary they point out that:
Because carbon dioxide in the atmosphere is long lived, it can effectively lock the Earth and future generations into a range of impacts, some of which could become very severe. Therefore, emissions reduction choices made today matter in determining impacts experienced not just over the next few decades, but in the coming centuries and millennia. Policy choices can be informed by recent advances in climate science that quantify the relationships between increases in carbon dioxide and global warming, related climate changes, and resulting impacts, such as changes in stream flow, wildfires, crop productivity, extreme hot summers, and sea level rise.
Climate changes caused by carbon dioxide are expected to persist for many centuries even if emissions were to be halted at any point in time.
The NRC report demonstrates that stabilizing atmospheric carbon dioxide concentrations will require deep reductions in the amount of carbon dioxide emitted. Because human carbon dioxide emissions exceed removal rates through natural carbon “sinks,” keeping emission rates the same will not lead to stabilization of carbon dioxide. Emissions reductions larger than about 80 percent are required to approximately stabilize carbon dioxide concentrations. This is illustrated in Figure 7. 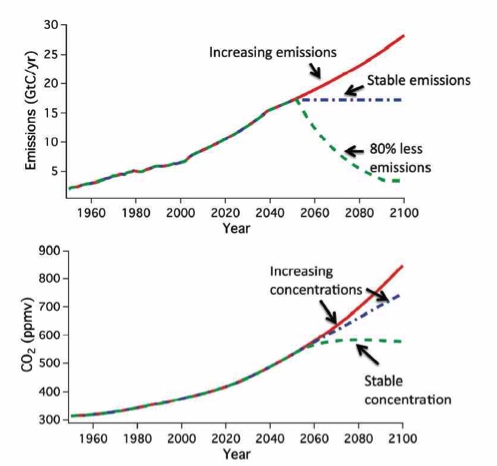
Top panel shows that stabilizing current emissions would, of course, stabilize the amount of CO2 emitted to the atmosphere. However, as shown in the bottom panel, only an 80% reduction in current emissions would stabilize the level of atmospheric CO2.
Stream flow Changes
Widespread changes in stream flow are expected in a warmer world, with many regions experiencing changes of the order of 5-15% per degree of warming.
Temperature Extremes
Extreme temperatures are expected to increase in a warmer world. For example, for about 3°C of global warming, 9 out of 10 northern hemisphere summers are projected to be “exceptionally warm” in nearly all land areas, and every summer is projected to be “exceptionally warm” in nearly all land areas for about 4°C, where an “exceptionally warm” summer is defined as one that is warmer than all but about 1 of the 20 summers in the last decades of the 20th century.
Extreme Precipitation 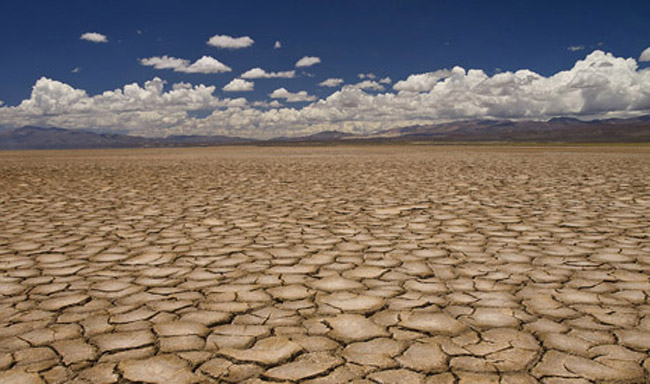
Drought in Australia
Extreme precipitation (heaviest 15% of daily rainfall) is likely to increase by about 3-10% per degree C as the atmospheric water vapor content increases in a warming climate, with changes likely to be greater in the tropics than in the extra-tropics (this sensitivity may decrease somewhat as the warming progresses).
Hurricanes and Typhoons
Averaged over the tropics as a whole, the number of tropical cyclones is expected to decrease slightly or remain essentially unchanged. Models suggest that the average intensity of tropical cyclones (as measured by the wind speed) is likely to increase roughly by 1-4% per degree C global warming, or by 3-12% per degree C for the cube of this wind speed, often taken as a rough measure of the destructive potential of storm winds.
Snow Cover and Snowpack
Current trends in snow cover over the Northern Hemisphere suggest that the snow cover season has shortened and spring melt is occurring earlier compared to the last 50 – 100 years. Modeled changes in Northern Hemisphere snow cover are similar to the observations. Future decreases are consistent across the models, and may reach -18% by 2090 (or a global warming of about 2 to 3°C). Snowpack has decreased over much of western North America since 1925 and this decrease has been linked to increasing temperatures over the West.
Snow pack is a vital determinant of the availability of fresh water. The consequences of the elimination of the snow pack in the Sierras would be disastrous to the water supply of Los Angeles.
Flooding
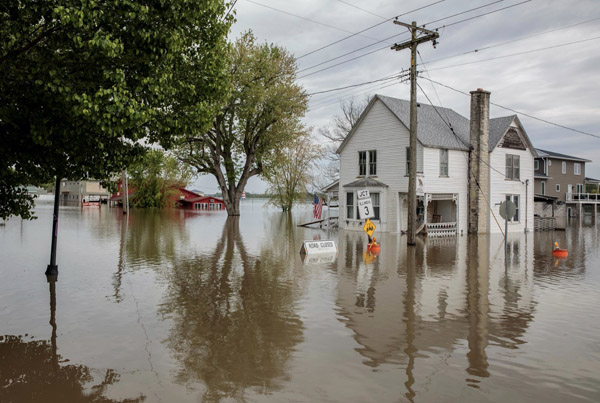 Flooding in Grafton, Ill by the Mississippi
Warming decreases yields of several crops in major growing regions, with ~5-10% yield loss per °C of local warming, or about 7-15% per °C of global warming. Global climate change is expected to reduce yields of key food crops in some tropical regions by about 7-15% over about the next 20 years. This can be expected to make it more difficult to keep up with increasing food demand even if continuing advances in technologies and agricultural practices are as effective as in the past. As a point of comparison, the global demand for cereal crops can be expected to rise by about 25% over the same period. Up to roughly 2°C global warming, studies suggest that crop yield gains and adaptation measures (especially in higher latitude areas) could balance yield losses in tropical and other regions, but warming above 2°C is likely to increase global food prices. Global warming of 2°C would be expected to lead to average yield losses of U.S. corn of roughly 25% (±16% very likely range) unless effective adaptation measures are discovered and implemented.
Fires
Studies are limited in number but suggest that warming of 1°C (relative to 1950-2003) is expected to produce increases in median area burned by about 200-400%. This is illustrated below.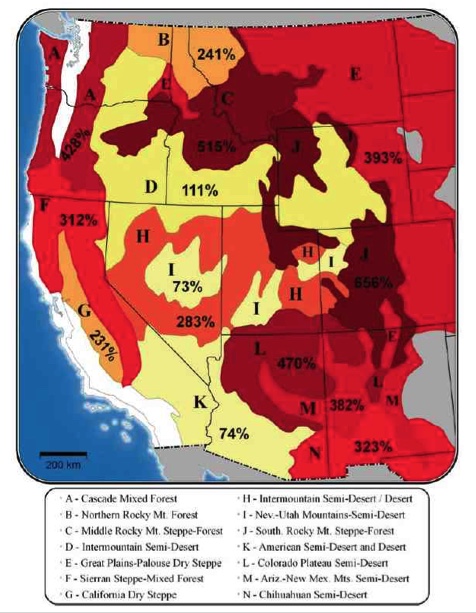
Percent increase relative to 1950-2003 in medium
annual area burned for the Western United States
with a 1oC increase in global average temperature.
Ocean Acidification 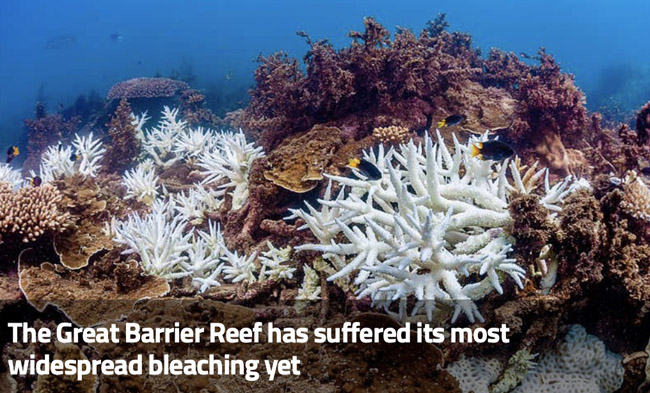
Rising atmospheric CO2 alters ocean chemistry, leading to more acidic conditions (lower pH) and lower chemical saturation states for calcium carbonate minerals used by many plants, animals and microorganisms to make shells and skeletons.
Impacts of CO2, pH and climate change on ocean biology The patterns and rates of ocean primary production will change due to higher sea surface temperatures and increased vertical stratification, altering the base of the marine food-web. The geographic range of many marine species is shifting poleward and to deeper waters due to ocean warming.
Coral bleaching events will likely increase in frequency and severity under a warmer climate. Over the last several decades, warmer sea surface temperatures have led to widespread tropical coral bleaching and increased coral mortality, and warming and more local human impacts are associated with declines in the health of coral reef ecosystems worldwide. Bleaching can occur for sea surface temperature changes as small as +1-2°C above maximal summer sea surface temperatures, which corresponds to global average warming of about 1.5-3°C.
Rising CO2 and ocean acidification will likely reduce shell and skeleton growth by marine calcifying species such as corals and mollusks. Some studies suggest a threshold of 500-550 ppm CO2 where coral reefs would begin to erode rather than grow, negatively impacting the diverse reef-dependent taxa.
Sea Level 
Assuming a doubling in ice discharge from both Greenland and Antarctica, the total global average sea level rise would be 0.88±0.12 m by 2100. We therefore estimate a range of total global sea level rise in 2100 of about 0.5 to 1.0 m (1.6 to 3.3 ft).
It has been projected that 0.5m of sea level rise would increase the number of people at risk from coastal flooding each year by between 5 and 200 million; as many as 4 million of these people could be permanently displaced as a result. More than 300 million people currently live in coastal mega-deltas and mega-cities located in coastal zones. The corresponding projections for 1.0m of sea level rise the number of people at risk of flooding each year would increase by 10 to 300 million.
Rising sea-levels will impact key coastal marine ecosystems, coral reefs, mangroves, and salt-marshes, through inundation and enhanced coastal erosion rates.
Infrastructure impacts Climate change impacts on infrastructure—including transportation, buildings, and energy—are primarily driven by changes in the frequency and intensity of temperature extremes and heat waves, heavy rainfall and snow events, and sea level rise.
Electricity
Climate change is expected to increase electricity demand and affect production and reliability of supply. Observed correlations between daily mean near-surface air temperature and electricity demand suggest warmer summer temperatures and more frequent, severe, and prolonged extreme heat events could increase demand for cooling energy.
Human health
Heat-related illness and deaths occur as a direct result of sustained, elevated levels of extreme temperatures during heat waves, which are projected to increase with increasing temperatures.
Climate change is likely to affect the geographic spread and transmission efficiency of illnesses and disease carried by hosts and vectors, but complexity precludes any quantitative estimates of the relationship between incidence of a given disease and temperature change.
Ecology and Ecosystems
For at least the last 40 years, many species have been and are currently shifting the timing of spring events in concert with warming temperatures. Examining 542 species of plants and 19 of animals, a large effect on timing of blooming, egg laying and migrating was found. In a study of 21 European countries for the last 30 years of the 20th century found a total of 78% of species were shifting their spring timing earlier and only 3% were shifting it later.
As the climate has warmed many species have been and are continuing to track this warming by shifting their ranges in to areas that before warming were less hospitable due to cooler temperatures.
Historically, extinctions of most species have been found to be due to various stresses, such as land-use change, invasive species, and hunting, but now the vulnerability of many species to extinction is enhanced with the added stress placed upon them by climate change.
Increase in earthquakes and tsunamis
An additional potential consequence of global warming has been well documented by Bill McGuire in his book Waking the Giant: How a Changing Climate Triggers Earthquakes, Tsunamis, and Volcanoes (13). Many studies have shown that raising (or falling) sea levels can trigger these events. As shown by very recent history, giant tsunamis can kill many thousands of people and disrupt nuclear power plants.
The Trees May Turn on Us
Planting trees has been touted by many environmental groups as the solution to climate change. However, recent detailed studies by Sullivan, et al, 2020 of over 500,000 trees in subtropical forests have shown that while they are capable of continuing to store C02 despite increasing global temperatures, there is a finite limit to this ability. When temperatures reach 20C over pre-industrial temperatures, trees will begin to release by respiration more CO2 than they consume by photosynthesis (Sullivan, et al, 2020; Pennisi, 2020). This would clearly qualify as a serious tipping point.
Sullivan, M.J.P. et al (2020) Long-term thermal sensitivity of Earth’s tropical forests. Science 368: 869–874
Pennisi, E. (2020) Tropical forests store carbon despite warming. Science 368:813.
Source of CO2 in the United States.
An essential aspect of knowing how to cut back on CO2 emissions is knowing where the CO2 comes from. Figure 9 shows the sources of CO2 emissions in the U.S.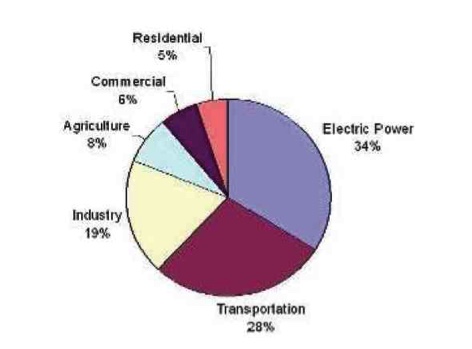
Greenhouse emissions by sector in the U.S.
We assume that the number of electric, fuel cell, and plug in hybrid cars will increase dramatically in the next 50 years helping to relieve the contribution of transportation to CO2 emissions. This leaves converting the production of electric power away from coal and toward solar, wind, and geothermal as the major goal in the fight to significantly reduce CO2 emission.
The ways the Comings Foundation can help mitigate the effects of climate change are given in the pages under Negative Emissions Technology. See especially the Comings Foundation Priority Projects and Additional Projects.
It is clear that global warming poses a significant problem to virtually all aspects of human existence on this fragile planet. As outlined above the economic impact of a 2 to 4oC rise in global temperature is huge. It is 100 to 1000 fold greater than the cost of reducing CO2 emissions now.
In a recent assessment (20), Wei et al (2020) stated, "If countries are even unable to implement their current NDCs, the whole world would lose more benefit, almost 149.78–791.98 trillion dollars until 2100. On the contrary, all countries will be able to have a significant positive cumulative net income before 2100 if they follow the self-preservation strategy."
Yes, that's 791 trillion with a T.
Two approaches to global warming are clearly needed:
1. Reduce current levels of atmospheric CO2 .
2. Eliminate coal (and gas) as a source of electricity worldwide.
As such the projects outlined in this website might have a significant effect on the problem of global warming.
The links to the 2018 National Climate Change Assessment are:
URL for scientific report 4th National Climate Change Assessment Vol I.
https://science2017.globalchange.gov
URL for Climate Change Effects
Vol II. Impacts, Risks, and Adaption in the U.S.
https://nca2018.globalchange.gov/
References
1. Hansen, James. Storms of My Grandchildren: The Truth about the Coming Climate Catastrophe and Our Last Chance to Save Humanity. Bloomsbury Press, New York, 2009.
2. Schneider, S.H. Science as a Contact Sport: Inside the Battle to Save Earth Climate. National Geographic Society, Washington D.C., 2009.
3. Dreskes, N and Conway, E.M. Merchants of Doubt: How a Handful of Scientists Obscured the Truth on Issues from Tobacco Smoke to Global Warming. Bloomsbury Press, New York, 2010.
4. Mooney, Chris. The Republican War on Science. Basic Books, New York, 2006.
5. Pielke, Jr., R. The Climate Fix. Basic Books, New York, 2010.
6. Kerr, R.A.: Both of the World’s Ice Sheets may be shrinking faster and faster. Science 326: 217,2009.
7. Kriegler, E., Hall, J.W., Hermann, H., Dawson, R. and Schellnhuber, H.J. Imprecise probability assessment of tipping points in the climate system. PNAS 106:5041-5046, 2009
8. Lenton,T.M., Hermann H., Kriegler,E., Hall, J.W., Lucht, W., Rahmstorf, S. and Schellnhuber, H. J. Tipping elements in the Earth’s climate system. PNAS.105:1786-1793, 2008
9. Atcheson, J.: Methane Burps: Ticking Time Bomb. Baltimore Sun, Dec 15, 2004.
10. Benton, M.J.: When Life Nearly Died: The Greatest Mass Extinction of All Time. Thames & Hudson, London, 2005.
11. Falkowski, P. The Power of Plankton. Nature 483:517-520, 2012.
12. Climate Stabilization Targets: Emissions, Concentrations, and Impacts over Decades to Millennia. Committee on Stabilization Targets for Atmospheric Greenhouse Gas Concentrations. National Research Council, National Academics Press, 243 pp, 2010. To download a free copy goto: http://www.nap.edu/catalog/12866.html
13. McQuire, B. Waking the Giant. Waking the Giant: How a Changing Climate Triggers Earthquakes, Tsunamis, and Volcanoes. Oxford University Press, USA 2012.
14. Shakhova, N. et al. Anomalies of methane in the atmosphere over the East Siberian Shelf: Is there any sign of methane leakage from shallow shelf hydrates? Geophysical Research Abstracts 10: EGU2008-A-01526 European Geosciences Union General Assembly, 2008.
15. The Climate Report 2018. The National Climate Assessment - Impacts, Risks, and Adapt in the United States. U.S. Global Change Research Program.
16. C. Welch: The Threat Below. Arctic Permafrost is thawing much faster than expected. Reshaping the land and releasing carbon gases that could speed climate change. National Geographic Sept, 74-99, 2019.
17. Dangerdork, S. et al: Persistent acceleration in global sea-level rise since the 1960s' Nature Climate Change 9:705-710, 2019.
18. Neukom, R. et al. No evidence fo globally coherent warm and cold periods over the preindustrial Common Era. Nature 371:550-554, 2019.
19. Lenton, T M. et al. Climate tipping points - too risky to bet against. Nature 575:592-595, 2019.
20. Wei, Y-M. et al (2020). Self-preservation strategy for approaching global warming targets in the post-Paris Agreement era. Nature Communications. https://doi.org/10.1038/s41467-020-15453-z